Multi-Touch Attribution: How to Measure Real Revenue Drivers

The AI CMO team
Oct 12, 2026

Your paid search team is celebrating a 300% ROI, while the content team is being told it contributed nothing. The board sees a clean last-click dashboard, but the people running campaigns see a mess of ads, search visits, email clicks, webinars, direct visits, and sales conversations that happened before the conversion.
That conflict usually isn't caused by bad marketing. It comes from asking a single-touch report to explain a multi-step buying journey. Multi-touch attribution offers a better way to describe how interactions share conversion credit, but it must be used carefully. It can diagnose journeys and guide optimization. It can't, by itself, prove which touchpoint caused additional revenue.
Table of Contents
- Why Your Current Attribution Is Lying to You
- How Multi-Touch Attribution Models Actually Work
- Choosing the Right Model for Your Marketing Organization
- The Hidden Trap Most Marketers Fall Into with Multi-Touch Attribution
- Building the Data Foundation for Reliable Attribution
- Closing the Gap Between Attribution and Incrementality
Why Your Current Attribution Is Lying to You
A last-click report can make a branded search visit look like the entire reason a prospect converted. Google Analytics defines last-click attribution as assigning all conversion credit to the final clicked interaction, while other models recognize earlier activity (Google Analytics attribution models). The rule is easy to explain. Its weakness is treating the final recorded step as the source of demand.
A prospect may first encounter a paid social post, read an organic article, return through branded search, attend a webinar, and submit a form after an email reminder. Last click may credit branded search or email. Content appears unproductive, while paid search receives more budget for capturing demand that could already have been created elsewhere.

The operational cost of single-touch reporting
Single-touch reporting still answers narrow questions. First touch can show which channels introduce prospects. Last touch can help conversion specialists inspect the final step. Trouble starts when either becomes the only scorecard for budget allocation.
Three failures follow:
- Demand creation gets underfunded: Content, social, display, and events can influence people before they become identifiable prospects.
- Intent capture gets over-rewarded: Branded search, retargeting, and direct visits often appear near conversion because they reach people already considering a purchase.
- Teams optimize against one another: Channel managers defend the metric that favors their work instead of examining the full customer path.
The Mobile Marketing Association's 2022 attribution benchmark reported that 53% of surveyed marketers were actively using multi-touch attribution, the first time a majority had done so, and described adoption as nearly 33% higher than the previous year (MMA's 2022 State of Attribution Benchmark Report). It also found that 70% of MTA users were satisfied with their ability to measure a large portion of marketing spend, compared with 42% of non-users, a 28-percentage-point gap.
Practical rule: Use MTA to inspect which interactions appear around revenue events, then seek incrementality evidence before shifting budget. A touchpoint can receive credit without causing additional revenue.
That makes MTA a directional diagnostic tool, not a causal verdict. A first-party data layer such as The AI CMO can connect campaign activity, content, email, social interactions, CRM stages, and revenue records, giving teams a workable base for attribution and controlled causal testing.
The same discipline applies beyond a standard website funnel. Teams comparing marketplace campaigns can use a structured guide to tracking Amazon ad performance when platform reporting and broader customer journeys do not align.
How Multi-Touch Attribution Models Actually Work
A prospect sees a paid social post, searches organically, clicks an email, attends a webinar, and later returns directly to convert. Attribution models assign credit across that same sequence. They do not create revenue. They offer different ways to describe the conversion.
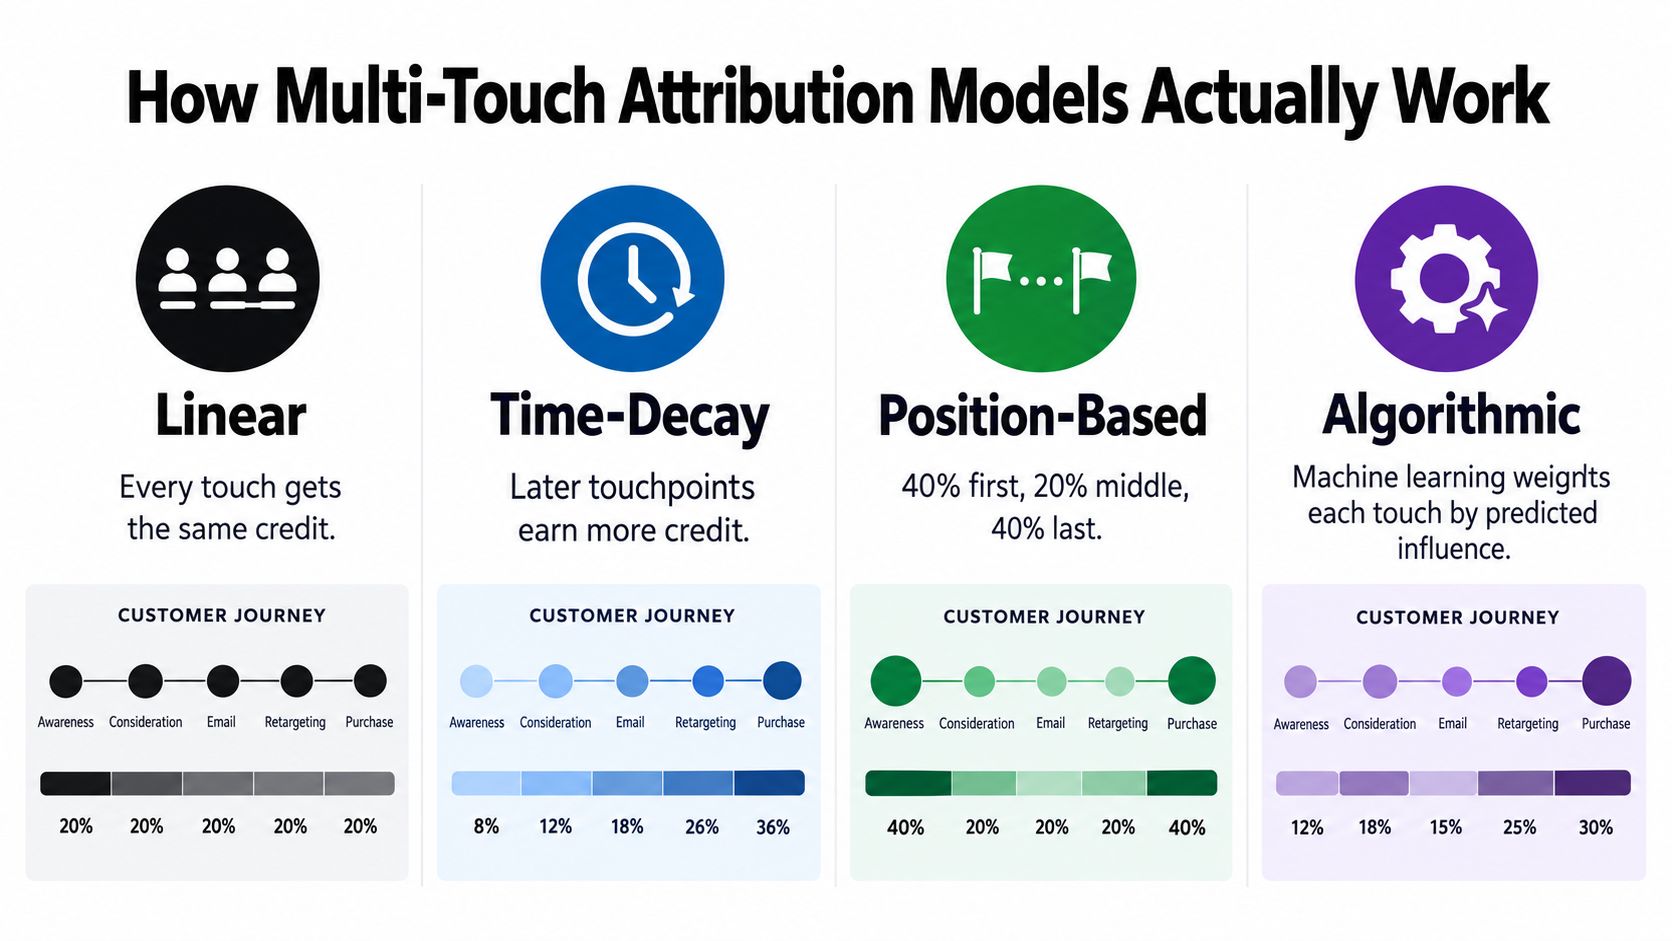
Fixed rules make the trade-offs visible
Linear attribution divides credit equally. With five qualifying touchpoints, each receives 20%. That simplicity makes the model easy to audit, but it treats a high-intent email click, a webinar, and a casual earlier interaction as equally influential.
Time-decay attribution gives greater weight to interactions closer to conversion. A seven-day half-life means an interaction eight days before conversion receives half the credit of one occurring one day before conversion. The rule can suit journeys where recency plausibly reflects influence, yet the half-life remains an assumption, not causal evidence.
Position-based attribution assigns 40% to the first interaction, 40% to the last, and divides the remaining 20% among middle interactions. With three middle touchpoints, each receives approximately 6.67%. The structure is easy for leadership to understand because it gives visible recognition to both demand creation and conversion.
Last-click attribution assigns 100% to the final clicked interaction. It works as a baseline because analysts can compare its output with broader models and see which channels gain or lose reported credit.
Data-driven attribution uses observed paths
Google Ads describes data-driven attribution as a machine-learning approach that distributes credit according to observed interactions across a conversion path. It can evaluate contacts from Search, Shopping, YouTube, Display, and Demand Gen campaigns instead of applying one universal split. Google recommends at least 200 conversions and 2,000 ad interactions within a 30-day period for a conversion action, so the model has enough path data to estimate contribution (Google Ads data-driven attribution). Those thresholds apply to the conversion action, not to total account activity.
| Touchpoint | Last-Click | Linear | Position-Based | Time-Decay | Data-Driven |
|---|---|---|---|---|---|
| First interaction | 0% | Equal share | 40% | Lower share | Estimated from paths |
| Research interaction | 0% | Equal share | Middle share | Lower or moderate share | Estimated from paths |
| Nurture interaction | 0% | Equal share | Middle share | Moderate share | Estimated from paths |
| Consideration interaction | 0% | Equal share | Middle share | Higher share | Estimated from paths |
| Final interaction | 100% | Equal share | 40% | Higher share | Estimated from paths |
The model answers a business question, so selection should follow the decision the team needs to make. Linear attribution can show balanced journey coverage. Position-based attribution offers a simple story for acquisition and conversion. A high-volume account with clean event data may qualify for data-driven attribution, but its output still needs validation against incrementality evidence.
Use MTA as a directional diagnostic tool. A first-party data layer such as The AI CMO can connect campaign activity, content, email, social interactions, CRM stages, and revenue records, creating a workable base for attribution and controlled causal testing. A broader guide to what marketing attribution means explains how these measures fit into a measurement strategy.
Affiliate teams face a similar distinction between contractual credit and analytical credit. Guidance on attribution models for affiliate programs helps separate those definitions before reported credit drives a budget decision.
Choosing the Right Model for Your Marketing Organization
The right attribution model depends less on elegance than on the decision a team needs to make. A model that helps a content team understand assisted journeys may be a poor tool for deciding whether total paid media spend should rise.
Match the model to the journey
Linear attribution works well as an educational baseline. It prevents one touchpoint from dominating the conversation and can help a B2B team display the breadth of a long journey. Its weakness is obvious once teams inspect individual paths. An accidental or low-intent interaction receives the same allocation as a meaningful product evaluation.
Position-based attribution is often easier for leadership to accept. The 40% first, 20% middle, and 40% last structure gives both demand generation and conversion teams a visible role. It can calm budget debates, but the weights are still arbitrary. A first interaction isn't always valuable just because it came first, and a direct final visit may reflect a decision made earlier.
Time-decay attribution makes sense when recent activity has a plausible relationship with purchase behavior. A promotion-driven commerce journey may respond to recent email or retargeting activity. A brand-building program may not. Teams should avoid using recency as a substitute for evidence that earlier exposure stopped mattering.
Last click remains a sensible baseline when journeys are short and the immediate conversion event is the primary optimization target. It becomes dangerous when a long research process is judged by the final click alone.
Volume changes what Google can model
Some Google Ads conversion actions have higher data requirements. Eligibility can require at least 3,000 ad interactions and 300 conversions during a 30-day period, followed by at least 2,000 interactions and 200 conversions in each subsequent 30-day period (Google Ads conversion action eligibility).
That constraint changes the operating decision. A conversion action may be conceptually suitable for data-driven attribution but still fail to qualify, or lose eligibility later when recent volume falls. Marketing operations teams should inspect each funnel event separately instead of assuming that account-level volume makes every conversion action eligible.
A useful selection process looks like this:
- Define the decision: Is the report for journey analysis, campaign optimization, channel budget allocation, or executive communication?
- Inspect the path: Count the observable interactions and identify whether major influence happens offline or across multiple stakeholders.
- Start with the simplest defensible model: Use a fixed rule when data quality or volume doesn't support a more complex approach.
- Compare outputs: Apply candidate models to the same historical paths and document which conclusions change.
- Reserve causal decisions for experiments: Don't raise or cut total spend solely because one model assigns more credit.
The most mature team isn't the one using the most complex model. It's the one that can explain what the model measures, what it misses, and which decision requires an experiment.
The Hidden Trap Most Marketers Fall Into with Multi-Touch Attribution
MTA observes what happened before a conversion. It doesn't show what would have happened without the marketing interaction.
A user who clicks a retargeting ad may already have a high purchase propensity. A person who searches for the brand may already know the company from a recommendation, sales conversation, or earlier content exposure. If those users convert frequently, an observational model can assign substantial credit to the retargeting ad or branded search even when the interaction changed little.

Correlation can look like contribution
Selection bias creates a recurring pattern:
- Retargeting gets over-credited because it reaches people who have already visited or shown intent.
- Branded search gets over-credited because high-intent prospects use the brand name near conversion.
- Demand creation gets under-credited because early exposure may happen before the identity is stable or before the user enters a measurable path.
- Direct traffic inherits missing context when referrals, messages, or untagged links lose their source information.
A complex model doesn't automatically solve this. Markov-chain attribution estimates a touchpoint's removal effect by comparing conversion probability with and without that interaction. Shapley-value attribution distributes credit according to average marginal contribution across possible touchpoint sequences (Markov and Shapley attribution analysis). Both approaches can represent path interactions more thoughtfully than first or last touch.
Neither approach proves causality. If the underlying audience was already more likely to convert, the model can still mistake audience selection for marketing lift.
The dangerous sentence is: “The model gave this channel credit, so the channel caused the revenue.”
A model can predict conversions accurately while remaining causally wrong. That distinction matters when a budget manager reallocates money directly from attributed revenue. The manager may move funds toward channels that are best at finding existing demand, amplifying the targeting bias rather than creating additional demand.
A practical measurement stack keeps two outputs separate. MTA shows which interactions appeared in customer journeys and how credit is distributed. Incrementality testing shows whether a controlled marketing exposure changed outcomes.
The following video can help marketing teams frame attribution as a measurement discipline rather than a single dashboard score.
The distinction is especially important in B2B, where several people may influence one opportunity and offline conversations may never appear in a click path. MTA can still organize the observable evidence, but it shouldn't pretend to see the entire buying committee or establish that every observed interaction created incremental pipeline.
Building the Data Foundation for Reliable Attribution
A model can't repair missing identity, broken timestamps, or duplicate conversions. Attribution-ready infrastructure starts with the events that connect a customer journey to a business outcome.
The minimum record should include a stable transaction ID, the conversion date and time, and at least one usable attribution identifier. Google Ads documentation lists hashed user-provided data and click identifiers such as GCLID, GBRAID, and WBRAID as acceptable identifiers for connecting conversions to observed ad interactions (Google Ads multi-source conversion data).
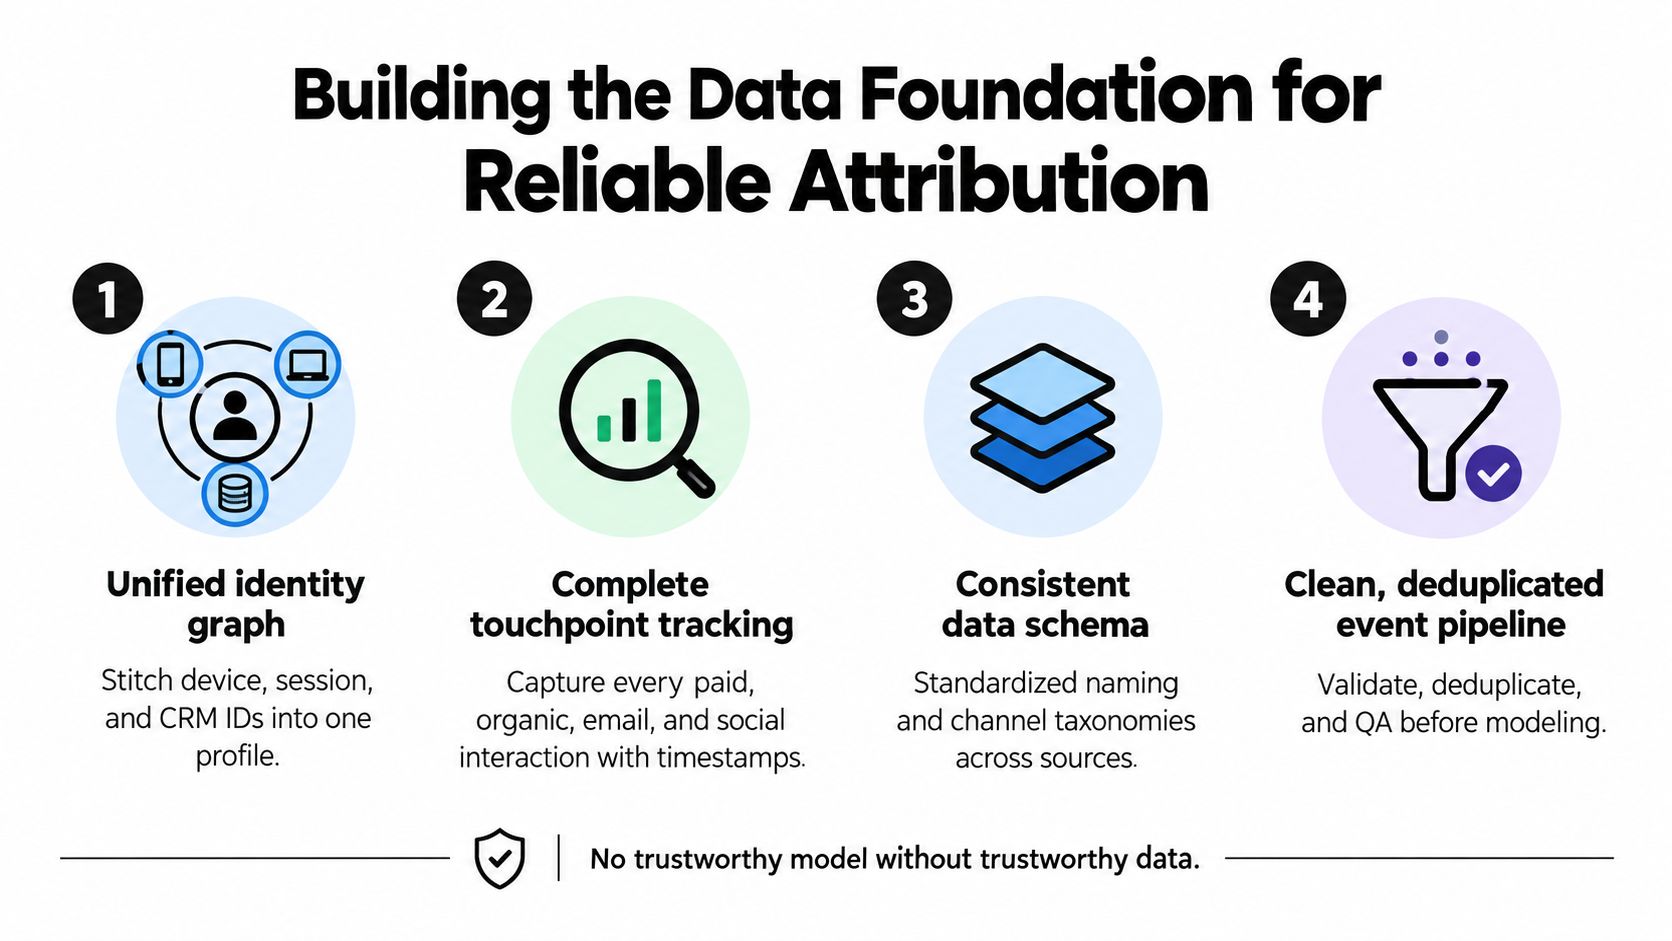
Four layers that prevent attribution gaps
Identity resolution links anonymous sessions, authenticated users, CRM records, and account relationships under consented rules. Without that layer, a mobile visit, desktop research session, email click, and CRM opportunity may look like unrelated activity.
Touchpoint capture records paid, organic, email, social, website, webinar, sales, and offline interactions with timestamps. A campaign report isn't a journey. The data must preserve the sequence of events.
A consistent schema gives every source the same channel taxonomy, campaign naming convention, event definition, and revenue relationship. Otherwise one report calls an interaction “Paid Social,” another calls it “paid_social,” and a third calls it “LinkedIn Ads.”
Deduplication and quality control stop one purchase, subscription, or opportunity from being counted repeatedly across ad platforms, web analytics, and CRM systems. Teams should validate events before the model reads them.
| Requirement | Purpose | Common Failure Point | Verification Method |
|---|---|---|---|
| Stable transaction ID | Connect one conversion across systems | Duplicate or missing order keys | Reconcile conversion records across CRM, commerce, and analytics |
| Conversion timestamp | Order events chronologically | Time zones or delayed imports | Inspect recent journeys for valid event order |
| Attribution identifier | Link conversion to an observed interaction | Missing click ID or unusable identity | Check identifier presence by source |
| Consistent channel taxonomy | Compare channels fairly | Platform-specific naming | Review mappings against a controlled vocabulary |
| Consent-aware identity | Respect user permissions while linking records | Unapproved or fragmented identity stitching | Audit collection and resolution rules |
| Complete touchpoint coverage | Reveal the actual observable journey | Missing offline, email, or social events | Compare journey records with campaign and CRM logs |
| Deduplicated events | Prevent inflated conversion totals | Multiple systems claiming one event | Match transaction keys and event timestamps |
A first-party warehouse can hold the shared event layer behind website SDK data, Shopify, Stripe, ad platforms, CRMs, files, and webhooks. The AI CMO is one example of a marketing operating system with a built-in first-party warehouse, Customer 360 records, consent-aware journeys, experiments, and reporting computed from the same data rows.
Teams evaluating this layer should also document where each event originated, how it changed, and who approved the transformation. Guidance on Fetchin on data provenance provides useful context for making that lineage visible.
A practical readiness check asks:
- Can the team trace a conversion: Does each conversion have a transaction key, timestamp, and usable identifier?
- Can systems agree: Do website analytics, CRM, commerce, and ad platforms use the same conversion definition?
- Can the warehouse preserve history: Are raw events retained separately from modeled attribution output?
- Can consent be enforced: Does identity resolution respect the permissions attached to the record?
- Can analysts reproduce a number: Will the same query return the same result across dashboards and AI answers?
For a deeper operating framework, teams can review a first-party data strategy that treats customer data as infrastructure rather than a collection of disconnected reports.
Closing the Gap Between Attribution and Incrementality
Attribution and incrementality answer different questions. Attribution asks how observed credit should be distributed across touchpoints. Incrementality asks whether marketing changed the outcome compared with what would have happened without the intervention.
The strongest technical safeguard for multi-touch attribution is an incrementality benchmark based on randomized experiments. A conversion observed after an ad exposure doesn't establish that the ad caused the conversion, because high-intent users are more likely both to encounter marketing and to convert. Randomized controlled trials assign eligible users or regions to treatment and control, then measure the difference in conversion or revenue outcomes (randomized experiments for attribution validation).
A practical operating loop
A durable measurement program keeps the model and the experiment connected without confusing their jobs.
- Use first-party paths for diagnosis: Store time-ordered exposures, visits, lifecycle events, pipeline stages, and revenue records in one governed layer.
- Maintain holdout groups: Keep eligible customers or journeys unexposed to a selected intervention where the design permits it.
- Run suppression tests: Pause or suppress a channel for an appropriately defined population or region, then compare outcomes.
- Calculate measured lift: Treat incremental revenue as treatment outcome minus control outcome, with confidence intervals and a pre-specified exposure window.
- Calibrate the model: Compare model-assigned channel credit with experimentally measured lift, while retaining raw attribution output for journey analysis.
Decision rule: Use MTA to optimize the journey and use incrementality evidence to decide whether total spend should rise or fall.
This approach prevents a common mistake. A channel may receive useful MTA credit because it frequently appears in converting paths, yet fail to produce meaningful incremental revenue when a holdout is introduced. Another channel may appear modest in observed paths because identity is incomplete, then show positive lift in a controlled test.
Marketing leaders can connect this measurement practice to broader marketing ROI measurement, but the operating principle stays simple. First-party behavioral data explains how customers move. Experiments determine which touchpoints changed behavior. Neither output should replace the other.
The AI CMO combines a first-party customer data layer, cross-channel journeys, holdout groups, campaign reporting, and AI marketing specialists so teams can connect observed paths with measured outcomes. Visit The AI CMO to see how a governed marketing operating system can help turn attribution from a disputed dashboard into a repeatable measurement workflow.
Share this article