While you run the business, The AI CMO runs the marketing.
It doesn't just generate marketing. It runs it – every channel, online and offline. It plans, creates, publishes, and learns what works – improving every week.
Grow repeat revenue 20% this quarter
Active
It finishes the job.
Posts published, emails sent, pages live – and journeys that trigger your own systems too, from your store's API to direct mail. Online and offline, without you pushing them.
Your summer restock is here
From hello@yourbrand.com · 2,847 recipients
34 customers in flight this week
Every channel, publishing
The posts, articles and creatives your strategy calls for – shipped on the calendar it set, whether or not you had time this week.
Pages that convert, on your domain
Every campaign lands on a page built to sell. Every lead is captured and followed up.
Email campaigns, sent and followed up
From your own domain. New customers get a welcome, quiet ones a reason to return – day and night.
Next week, already planned
The calendar refills itself from the strategy, so the work never waits on a brief.
Create → send → measure – without leaving the platform.
And everything it ships,
it makes.
Ads, video, email, blog, social, landing pages, plus print and event creative – whatever the channel calls for, online or offline, produced in your brand and shipped by the same system that decided to make it.
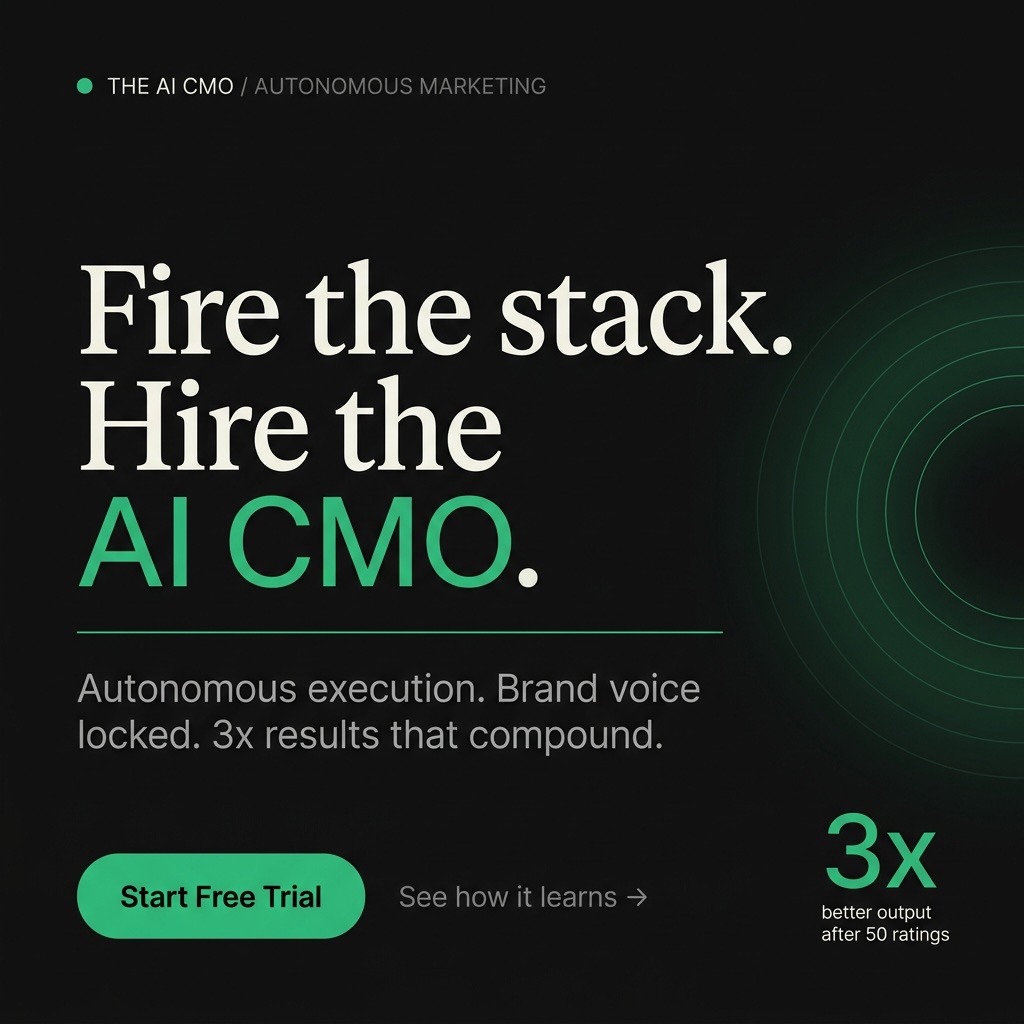
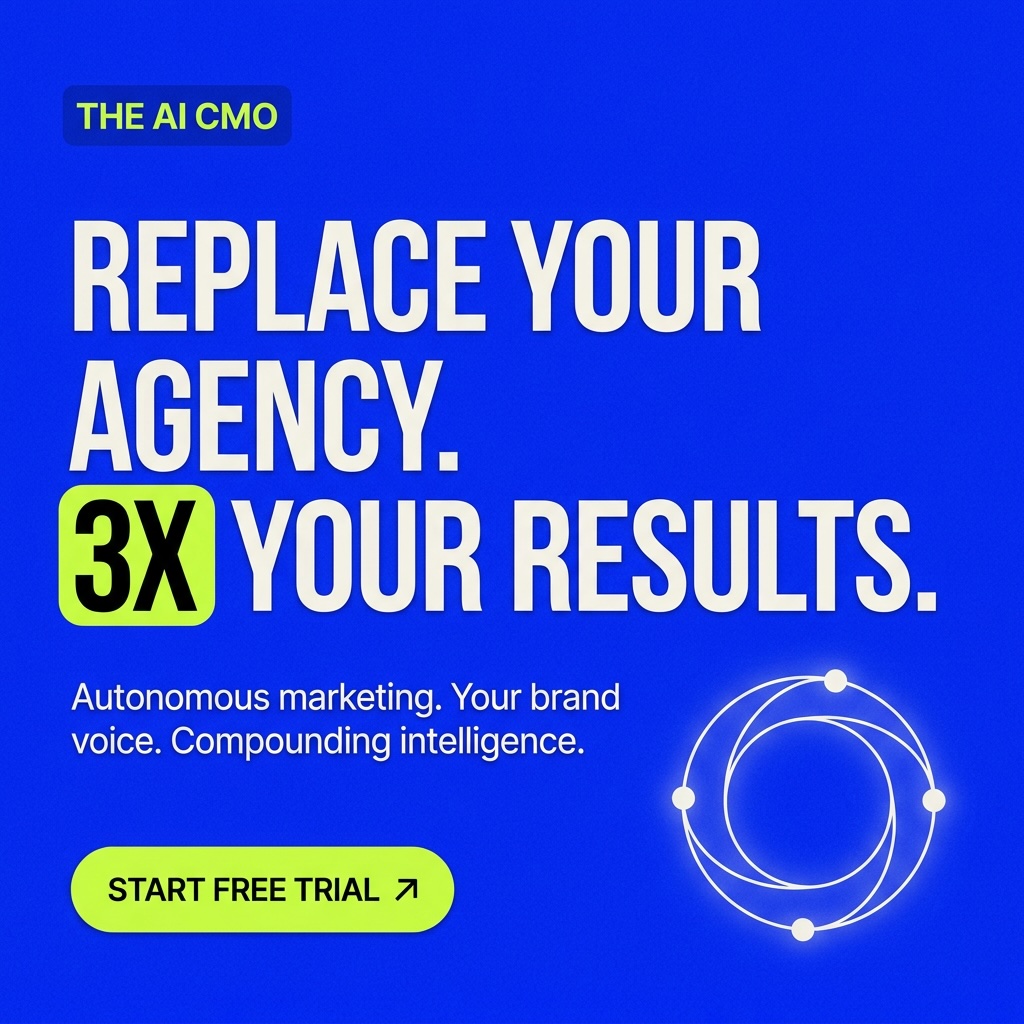
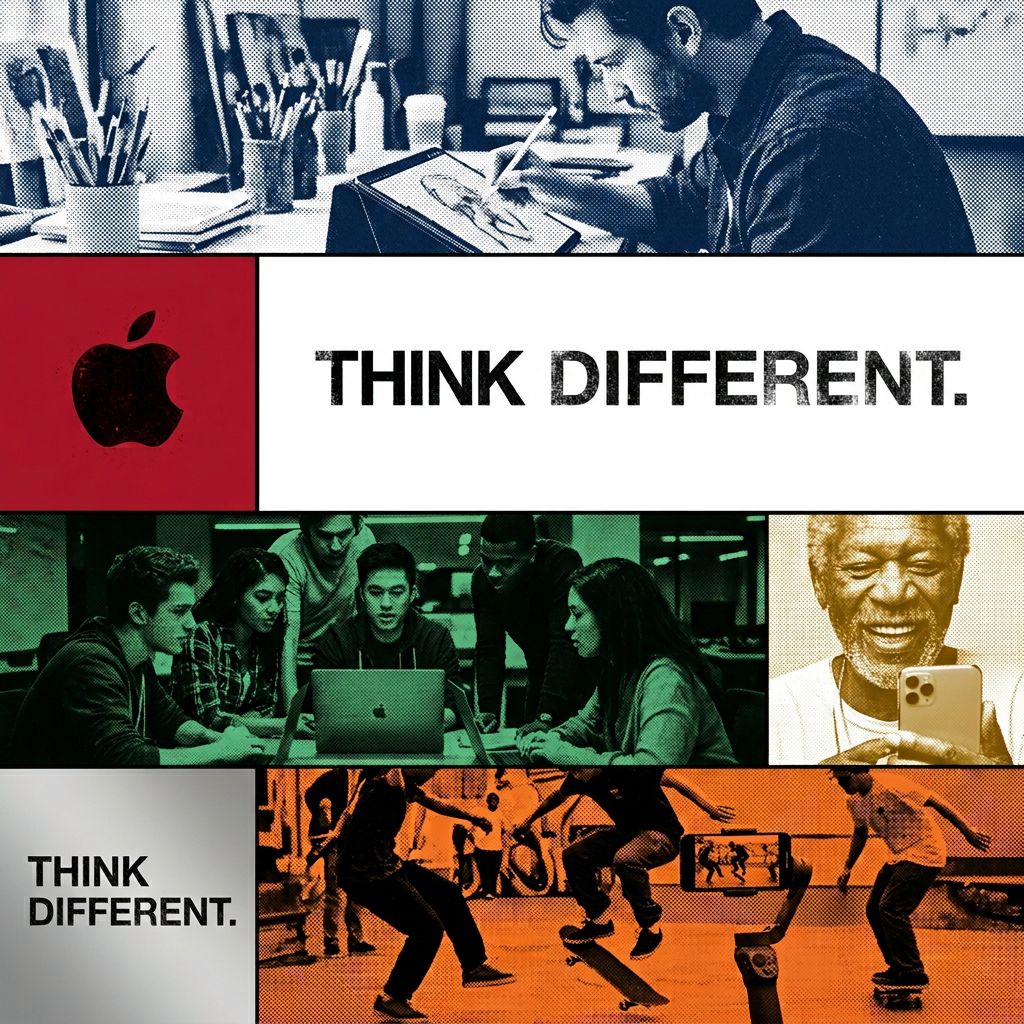
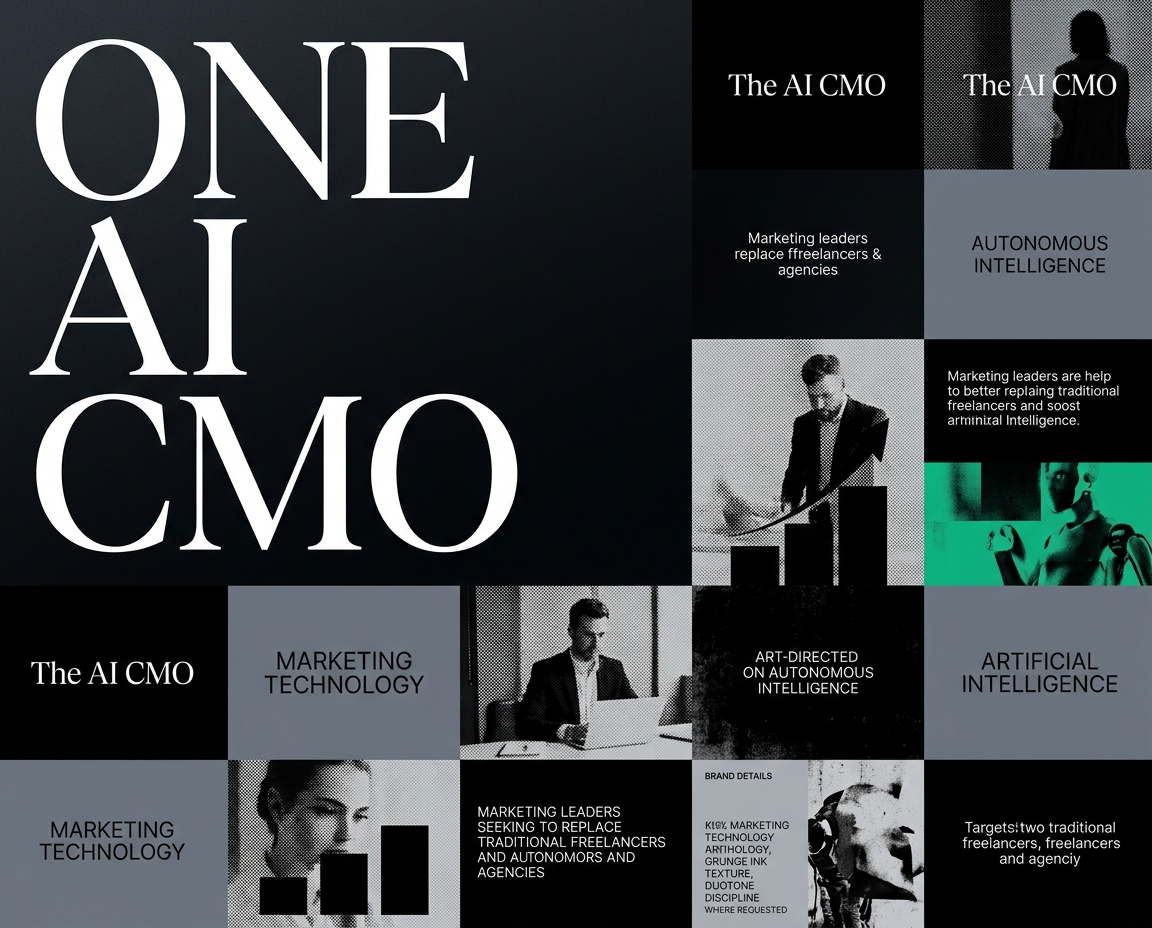
Generated by real customers, rendered to native spec, ready to ship.
Why an AI marketing agent beats stitching together AI tools.
ChatGPT for copy. Canva for visuals. Jasper for blogs. A general-purpose chatbot for the rest. You write the brief, you prompt, you copy-paste, you schedule. The AI is fast – you're still the bottleneck.
01
Tools wait for your prompt.
It starts on its own.
It checks the calendar, sees what's due, drafts it, and queues it for your review – before you open the tab.
02
Tools forget every session.
It remembers your brand and last week's results.
Voice, audience, what won, what flopped. The context carries forward instead of starting from zero every Monday.
03
Tools hand you a draft.
You get a campaign that ran.
Strategy, assets, schedule, publish, measure, adjust – end to end, on one platform, by Friday.
Most AI stops at the draft.
The AI CMO keeps going.
It launches the work, measures what actually happened, and feeds the result into the next plan – so the system compounds, getting sharper with every campaign it runs.
Plan
Strategy, channels, and budget – from one goal you set.
Create
Every asset, written and designed in your brand voice.
Launch
Published across channels, on schedule, automatically.
Measure
Results and attribution, unified in one place.
Improve
What worked feeds the next plan, not a forgotten report.
Set a goal.
It plans the rest.
The AI CMO breaks your goal into a campaign plan, writes every asset, publishes on schedule, and reports back.
Autonomous Mode
AI marketing on autopilotLaunch our Q2 product campaign
ActiveFocus on medium-size businesses that can invest in our monthly subscription.
The AI planned and ran all 13 steps – drafted, built, shipped, and adjusted mid-campaign without pausing for approvals between steps.
A strategy engine.
Not another AI prompt.
It picks the mode – standard, unconventional, guerrilla, brand, or controversial – then plans the full mix across every channel your customers actually touch, online and offline: email, paid social, search, SMS, direct mail, events, in-store. You get a complete 30–90-day plan with 10+ tactics, audience segments, experiment hypotheses, and a full measurement plan. No workshop required.
Become the Default Answer
Be the brand search engines and AI recommend first
For marketing leaders and lean growth teams at 50–500 employee companies, The AI CMO is the autonomous marketing operating system that turns strategy into live omnichannel campaigns without constant re-briefing.
- Publish AI CMO + agency-vs-AI CMO pages
- Launch Founding 50 page with cohort counter
- Add FAQ schema to the top 10 pages
- Ship one flagship 0-10-50 ratings teardown
Every tactic links to the tools that execute it.
Every marketing surface.
One workspace.
Ads, email, social, SEO, video, landing pages, analytics – 70+ tools that share one brand memory. Nothing gets re-briefed when work moves between them.
The 2026 B2B marketer's field guide to AI agents
Triggered agents for onboarding, launches, win-backs.
 Google
 Meta
Meta LinkedIn
 HubSpot
 Shopify
 Slack
SlackEvery source piped into one brain. 3,400+ integrations.
Every surface searchable via⌘K
Your entire stack.
One intelligent layer.
Already have tools? Connect 3,400+ of them – acquisition, retention, CRM, commerce, analytics, even project management. Starting fresh? The AI CMO is a complete marketing platform on its own. Plug in your stack, or run it all here.
Most teams run 15–20 disconnected martech tools. The AI CMO consolidates the stack – or becomes it: acquisition, retention, CRM, commerce, analytics under one intelligent layer with one memory. How consolidation works →
Sources
ShopifyHubSpotGoogleSlackThe AI CMO
Autonomous Intelligence
Channels
GoogleMetaLinkedIn Mailchimp
3,400+ integrations · Acquisition · Retention · CRM · Commerce · Analytics · Project management
Enterprise teams use The AI CMO to consolidate 20+ martech line items into one contract.
We were tired of marketing
that forgets everything.
Petr Royce
Founder, The AI CMO
Every team I worked with hit the same wall. Making content was never the hard part – a dozen AI tools can do that. The problem was that each one forgot everything the moment it finished. Nothing remembered the brand. Nothing learned from last month. And marketing only compounds when its knowledge does.
So we built a system instead of another tool. The AI CMO learns your voice, remembers your audience, runs the strategy, writes every asset, ships across channels, and adjusts based on what actually performed. One context. One memory. One operator. And because it remembers, every campaign makes the next one sharper.
Today founders, in-house teams, and agencies use it to go from goal to live campaign in minutes – and to compete with companies a hundred times their size without hiring a hundred-person team.
Priced by the role, not the tools.
From $299/mo.
Every creation tool is on every plan – you scale capacity, not access. Or start with the Intern at $49.
Built for in-house teams, consultants, and agencies – every plan runs as one workspace with a shared credit pool, and team seats scale with the plan.
Assistant
You create. The AI does the heavy lifting.
The work a marketer handles ($3–5k/mo)
- 3 brands
- 3 team seats
Included capacity
1,000 credits / month
- ~500 images
- ~40 videos
- ~200 blog posts, emails or ad copies
- 5,000 emails sent for you, from your domain
- Web analytics up to 500,000 events / month
- Customer data warehouse – holds 50,000 events
- Every asset your marketing runs on – images, video, ad copy, blogs, landing pages, email
- One autonomous specialist – hire an AI marketer that watches your numbers and proposes the next move
- A real strategy, planned and adjusted as results come in – not one-off content
- Learns your brand voice once, then writes in it everywhere
- One read on what's working and the next move to make – no dashboard hunt
- See rival ads, pricing, and positioning before they out-pace you
- All your customer and campaign data, unified – your own data warehouse
- Reach customers directly with contacts and automated email journeys
- Email support – replies within 72 hours
Manager
The AI plans, makes, and ships. You approve.
The work a marketing manager handles ($7–10k/mo)
- 10 brands
- 10 team seats
Included capacity
5,000 credits / month
- ~2,500 images
- ~200 videos
- ~1,000 blog posts, emails or ad copies
- 25,000 emails sent for you, from your domain
- Web analytics up to 1M events / month
- Customer data warehouse – holds 100,000 events
- Everything in Assistant
- A team of autonomous specialists – they plan, make, and ship campaigns end-to-end; you just approve
- Nothing goes live until you say so – brand guardrails on every draft
- Reach the right customers with segments and targeting, not blasts
- Your whole team works from one library – every brand in its own voice
- The repetitive work runs itself with automations
- Priority support – within 48 hours
CMO
The AI runs your entire marketing system.
The responsibilities of a fractional CMO ($15–30k/mo)
- 25 brands
- 25 team seats
Included capacity
10,000 credits / month
- ~5,000 images
- ~400 videos
- ~2,000 blog posts, emails or ad copies
- 100,000 emails sent for you, from your domain
- Web analytics up to 2M events / month
- Customer data warehouse – holds 200,000 events
- Everything in Manager
- Customer Intelligence – the AI finds your best segments and what moves them
- Campaigns you trust publish on their own – you set the confidence bar
- See exactly what's driving revenue, with attribution across every channel
- Priority support — the highest level on a standard plan
- Shaped around your stack with integration-level customization
Enterprise
Your autonomous marketing department.
For teams scaling beyond in-house
- Unlimited brands
- Unlimited members
Included capacity
Custom allocation
- Millions of warehouse events / month on a dedicated cluster
- Custom AI credit allocation
- Custom email & SMS volume, from your domain
- SLAs & uptime commitments
- Everything in CMO, without the standard event caps
- A dedicated data warehouse cluster sized to millions of events — well beyond the 200,000-event standard limit
- A named success manager and an executive sponsor who know your account
- Single sign-on (SSO / SAML) across your whole org
- SOC 2 artifacts and a security review your team can vet
- 99.9% uptime, backed by SLA credits
- Custom integrations and white-glove onboarding built for you
- Your roadmap requests move to the front of the line
- Dedicated infrastructure, plus MSA, DPA, and procurement support
Not ready for a full hire? Start with the Intern.
150 credits a month – enough for ~75 images, ~6 videos, or ~30 posts and emails. Step up anytime.
Cancel anytime. No contracts, no lock-in.
Email sending is included on every plan, sent from your own domain. Need SMS too? We offer it on a custom plan – .
Run out mid-month? Top up credits anytime – no plan change needed.
Chat itself doesn't draw credits. Production tools – text, image, and video – spend credits; text tools typically cost the least, video the most.
Frequently asked questions
What is an AI marketing agent?+
How is The AI CMO different from ChatGPT, Jasper, or Klaviyo?+
Will it actually sound like my brand?+
How fast can I create campaigns?+
Can I cancel anytime?+
What is Autonomous Mode and how does the AI agent work?+
Can I control what the AI publishes automatically?+
Can The AI CMO replace my martech stack?+
Start your first campaign today.
Give The AI CMO a goal. Watch it plan, create, launch, and compound.